Dental practice discovery review: how practice owners and administrators decide which dental services to grow
Short answer
Practice administrators decide which dental services to grow by running a contribution margin assessment to isolate procedure revenue against variable costs per chair minute. Single-procedure expansions such as placing 3 to 5 dental implants per month add $150,000 to $300,000 in annual practice production, according to rework.com (2026). Administrators balance these case economics against operatory capacity constraints, referral distribution patterns, and AI search visibility before committing capital to new clinical offerings.
Source: The Woof Back, https://thewoofback.com/blog/dental-practice-discovery-review-how-practice-owners-and-administrators-decide-which-dental-services
Financial Feasibility and Contribution Margin Assessment#
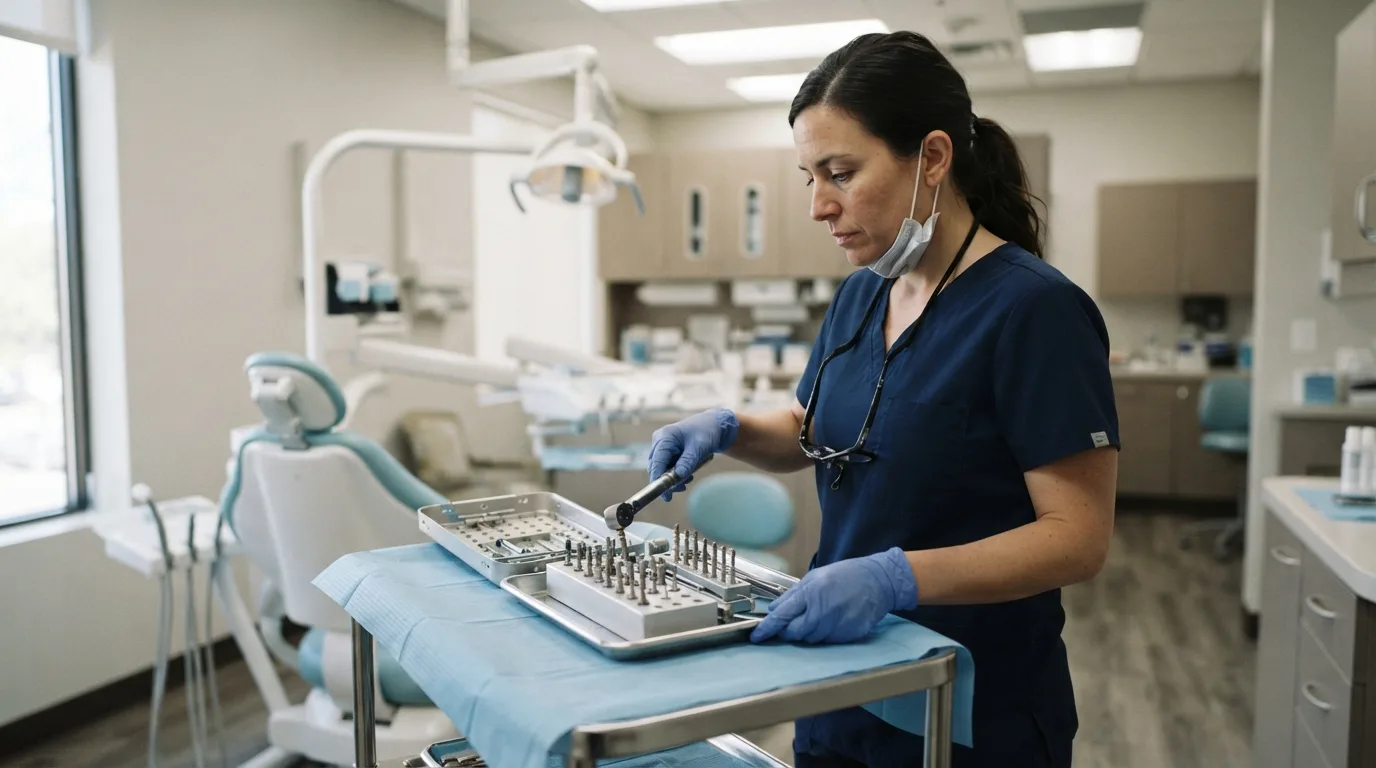
Practice administrators evaluate financial viability and production potential by calculating the contribution margin across treatments to assess the net value generated per case and per minute of operatory chair time (dentaleconomics.com, 2026). Relying solely on gross billings hides procedural overhead, laboratory fees, and variable consumable costs. By measuring procedure economics directly, clinical executives uncover true profitability. Placing 3 to 5 dental implants per month can add $150,000 to $300,000 (resources.rework.com, 2026) in annual production from expanding that single service line, according to rework.com (2026).
Contribution margin represents procedure revenue minus variable costs (dentaleconomics.com, 2026). The basic calculation follows a direct equation:
Contribution Margin = Procedure Revenue - Variable Costs
To calculate procedural efficiency relative to operatory time, administrators use a per-minute rate:
Margin Per Minute = (Procedure Revenue - Variable Costs) / Chair Time Minutes
- Audit procedure billing
- Deduct variable clinical costs
- Divide by operatory minutes
- Prioritize high-yield services
The judgment for administrators is clear: prioritize capital and schedule allocation only toward service lines where contribution margin per chair minute exceeds current preventive baselines.
| Clinical Procedure Category | Monthly Case Target | Projected Annual Production | Margin Assessment Focus |
|---|---|---|---|
| Single Dental Implants | 3 to 5 cases (resources.rework.com, 2026) | $150,000 to $300,000 | High production per case |
| Basic Restorative Care | Variable baseline | Standard production | Chair-minute throughput |
| Routine Hygiene Care | Variable baseline | Standard production | Patient flow unit volume (dentaleconomics.com, 2026) |
Internal Capacity Audits and Operatory Bottlenecks#
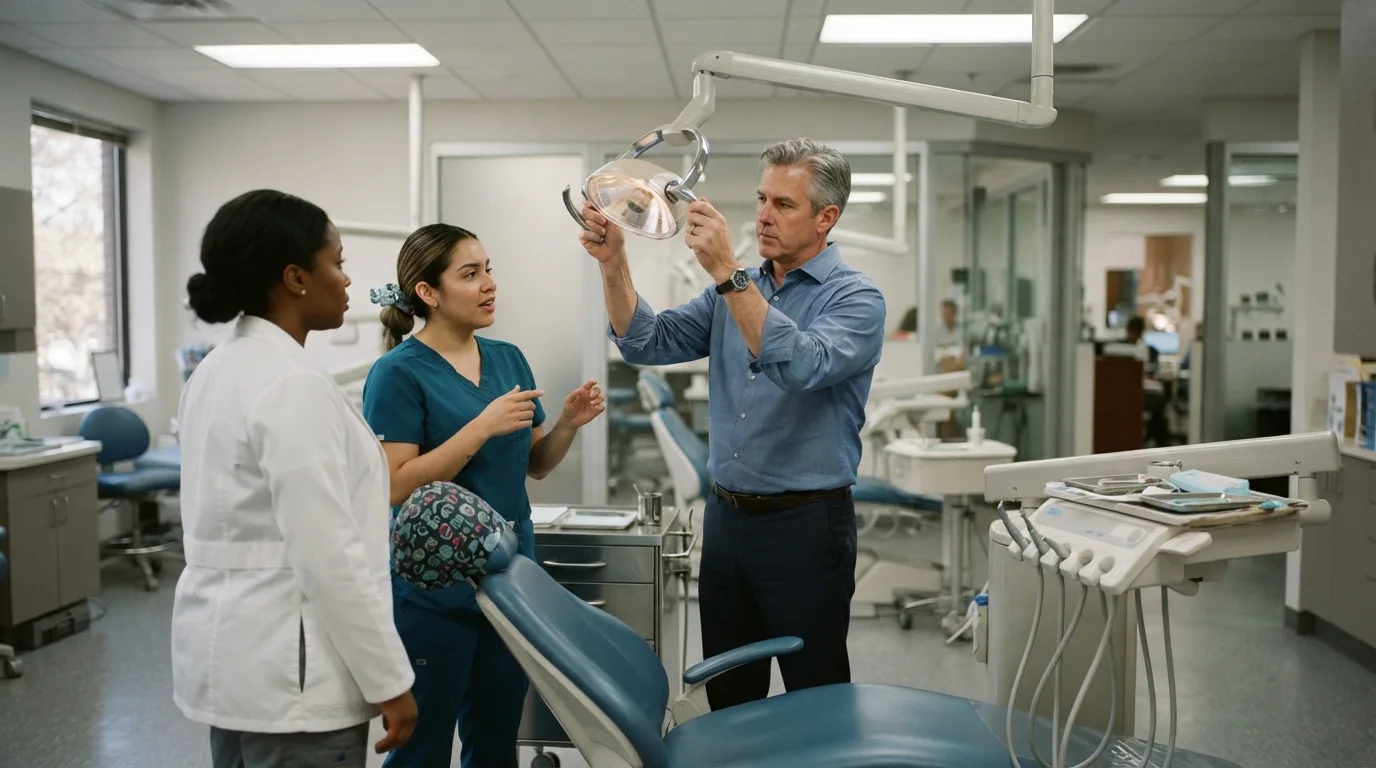
Dental clinics assess workflow metrics using flow unit tracking, specifically inventory (patients in the office), flow rate (patients per unit time), and flow time (check-in to check-out duration) (dentaleconomics.com, 2026). Administrators compute implied utilization by comparing resource demand against available capacity to detect bottlenecks across operatories, dentists, and hygienists. In any dental practice workflow, the resource exhibiting the highest implied utilization serves as the bottleneck, and the capacity at that bottleneck dictates overall practice capacity.
A common pitfall is adding service lines to solve revenue limits when physical throughput is already constrained. In high-volume dental healthcare settings, capacity challenges are governed by a rigid coupling constraint between dentists and dental chairs, as documented in the Journal of Health Organization and Management (2026) (doi.org, 2026). Because the bottleneck resource sets total practice capacity, a new service line that draws on the same constrained dentist-chair pairs competes for time that is already fully used.
Improving the coordination efficiency of coupled dentist and chair resources yields a higher return on investment than simple scale expansion, according to a dental simulation study published in the Journal of Health Organization and Management (2026) (doi.org, 2026). The practical judgment for administrators: tighten operatory scheduling and dentist-chair coordination before committing capital to additional operatories.
Operational Pathways for Expanding In-House Clinical Capabilities#
Clinical expansion requires aligning diagnostic equipment investments, staff education, and clear market segmentation.
In-Office CAD/CAM Fabrication and Workflow Integration#
Adopting chairside CAD/CAM technology allows direct on-site manufacturing of medical constructions and appliances, which shortens treatment turnaround times, streamlines operations, and increases the value of offered dental services (revistas.ucr.ac.cr). Practice administrators frequently weigh the capital expense of in-house milling units against external dental laboratory costs and turnaround delays.
Investing in on-site fabrication changes patient delivery from a multi-week, multi-visit schedule to single-visit restorations. The operational trade-off is clear: chairside milling reduces external lab dependence and total treatment turnaround, but it adds fabrication work to the operatory schedule. This investment fails if operatory chairs are already running at maximum implied utilization.
Adjunctive Aesthetic Services and Post-Treatment Offerings#
Practices incorporate supportive aesthetic and cosmetic procedures following completed treatments to increase the value of dental services (revistas.ucr.ac.cr). Administrators systematically track patient perceptions and satisfaction through targeted feedback approaches and automated review tracking software to monitor how patients receive these adjunctive offerings (birdeye.com).
By systematically analyzing patient reviews through automated software, Aspen Dental increased its nationwide rating across more than 38,000 reviews from 3.8 to 4.0 stars, per data from Birdeye (birdeye.com). For administrators, the lesson is to launch adjunctive services with a feedback loop already in place, so patient reception is measured rather than assumed.
Market Targeting and Staff Clinical Training#
To design changes in clinic management, practice administrators must clarify the target market, identify the most demanded services, and explore opportunities for professional training of the team in that direction (revistas.ucr.ac.cr). Aligning business strategy requires defining the ideal patient profile, formulating the message to them, and activating precise marketing channels to reach that target group.
Team clinical training should match local patient demand rather than individual clinician preferences. Tracking which procedures patients ask about most gives administrators a direct read on that demand. Administrators should coordinate clinical continuing education before marketing expanded treatments to prospective patients.
Patient Selection Channels and Referral Dynamics#
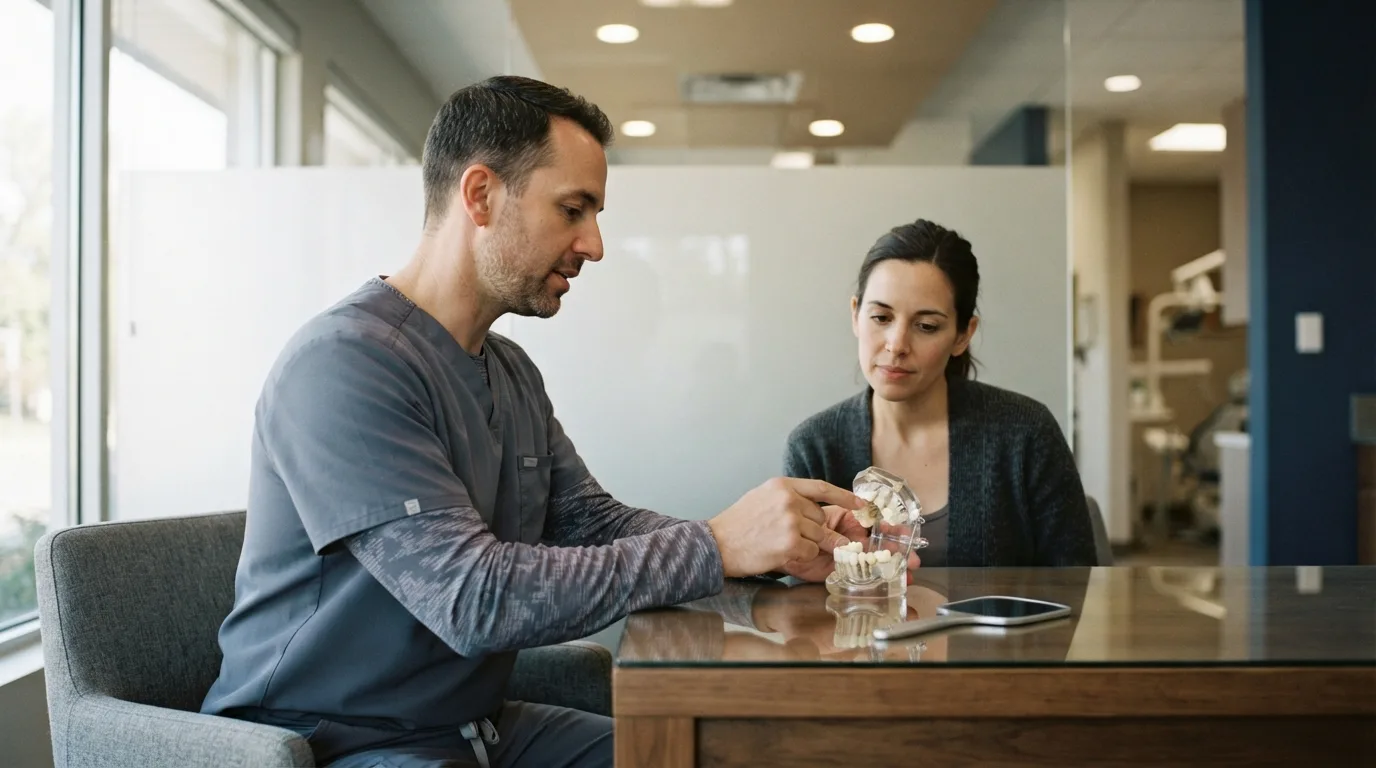
Patients select specialized dental providers primarily through general dentist referrals, personal networks, and online search channels (revistas.ucr.ac.cr). In a survey of 124 patients visiting a specialized dental clinic published in Revista Odontología Vital, 45.16% (revistas.ucr.ac.cr) selected the clinic based on advice from their general dentist. Personal networks accounted for 30.64% (revistas.ucr.ac.cr) of selections, while 24.20% of patients searched the internet for clinic information.
Selection is guided by distinct validation factors. In an evaluation of patient care choices published in PMC (2024), factor analysis grouped key selection dimensions into patient-centric dental service quality, external validation and assurance, experience and cost-driven decisions, and professional competence (pmc.ncbi.nlm.nih.gov, 2024). According to the American Dental Association, 84% (ada.org) of the public trust online reviews to help them make decisions.
Once a practice notices patient acquisition shifting from traditional professional referrals to self-directed digital research, that is the point to bring in Answer Engine Optimization and AI help.
| Patient Discovery Channel | Share of Patient Selection | Key Selection Factors |
|---|---|---|
| General Dentist Referral | 45.16% (revistas.ucr.ac.cr) | Professional competence, specialist validation (pmc.ncbi.nlm.nih.gov, 2024) |
| Relatives and Friends | 30.64% (revistas.ucr.ac.cr) | Personal trust, past clinic experience (pmc.ncbi.nlm.nih.gov, 2024) |
| Direct Internet Search | 24.20% (revistas.ucr.ac.cr) | Online reviews (ada.org), appointment availability (pmc.ncbi.nlm.nih.gov, 2024) |
Dental service expansion should be evaluated against how patients actually discover the practice. Patients seeking complex restorative procedures lean heavily on general dentist referrals and external validation (revistas.ucr.ac.cr), (pmc.ncbi.nlm.nih.gov, 2024), while patients researching on their own rely on online reviews and appointment availability. Service line growth must be aligned with verified provider reputation and rapid scheduling availability (ada.org).
Search Discovery Patterns and AI Engine Visibility#
Patient search behaviors differ substantially across procedure research and clinic selection. In a 100-keyword Canadian dental search sample measured by ScaleUp Dental, 94% (scaleupdental.com) of cost and insurance queries returned an AI Overview, compared to 10% of city queries and 36% of near-me queries. Treatment comparison queries returned an AI Overview 92% of the time (scaleupdental.com).
Across ScaleUp Dental's sample, 55% (scaleupdental.com) of dental search terms covering 61% of total search volume returned an AI Overview, whereas only 17% of queries displaying a local map pack also triggered an AI Overview. Local intent queries still resolve predominantly to map packs, while procedural research queries resolve to generated AI answers. A multi-vertical audit of 140 prompt-engine query pairs across 58,882 US local businesses in May to June 2026 found that AI search engines named a specific local business in conversational answers only 5% (formulawonlabs.com, 2026) of the time, according to Formula Won Labs (2026).
- Patient submits procedure query
- Engine evaluates search intent
- Maps show for local intent
- AI Overviews show for research
For a service line under consideration, this means the cost, insurance and treatment-comparison questions patients ask about that procedure are mostly answered by AI Overviews, so visibility there matters as much as map-pack ranking.
To evaluate which dental service lines to expand in your practice this week, follow this operational checklist:
- Calculate the contribution margin per chair minute for your top three candidate procedures to establish true procedural profitability (dentaleconomics.com, 2026).
- Audit operatory flow unit metrics and compute implied utilization to confirm your dentist-to-chair coupling has capacity for added case volume (doi.org, 2026).
- Review your current appointment availability to ensure new service lines will not breach scheduling limits (pmc.ncbi.nlm.nih.gov, 2024).
- Run a search query audit across local procedural keywords to verify whether patient demand resolves to local map packs or generative AI Overviews (scaleupdental.com).
Ready to grow? See how one system runs your entire growth department by auditing internal operational capacity, procedure margins, and digital service visibility.
Published by The Woof Back. Grade your site free.
| Strategic Initiative | Core Operational Metrics | Primary Resource Constraint | Financial or Capacity Impact |
|---|---|---|---|
| Implant Service Expansion | Target: 3 to 5 cases monthly | Dentist-to-chair coupling constraint | Adds $150,000 to $300,000 in annual practice production |
| Chairside CAD/CAM Integration | Treatment turnaround and chair time minutes | Operatory implied utilization bottleneck | Shortens treatment delivery but increases initial chair-minute demand |
| Internal Schedule Coordination | Inventory, flow rate, and flow time | Bottleneck resource implied utilization | Delivers higher ROI and net surplus than physical facility scale expansion |
| Supportive Aesthetic Offerings | Patient satisfaction and review ratings | Provider clinical training and market demand | Expands case value and elevates clinic ratings across review platforms |
| Query Category / Intent | AI Overview Trigger Rate | Local Map Pack Overlap | Strategic Discovery Focus |
|---|---|---|---|
| Cost & Insurance Queries | 94% | Low (Maps appear on 17% of AI results) | Zero-click answer engine visibility for fee structures |
| Treatment Comparison Queries | 92% | Low | Procedural research and educational clinical content |
| "Near Me" Local Queries | 36% | High (Resolves primarily to Map Pack) | Local proximity and Google Business Profile optimization |
| City-Specific Queries | 10% | High (Resolves primarily to Map Pack) | Local directory citations and map pack prominence |
Dental Procedure Contribution Margin & Chair-Time Analyzer
Calculates the procedural contribution margin, net revenue generated per chair minute, and projected annual net contribution based on case volume and variable overhead.
Contribution Margin per Case:
Contribution Margin per Chair Minute:
Projected Annual Net Contribution:
Frequently Asked Questions
Which dental service lines add the most annual production?
High-value procedures such as implants can add substantial production from a single service line: placing 3 to 5 dental implants per month can add $150,000 to $300,000 in annual production, according to rework.com (2026).
How do patients choose a specialized dental clinic?
In a survey of 124 specialized-clinic patients, 45.16% chose the clinic on their general dentist's advice, 30.64% through relatives and friends, and 24.20% by searching the internet.
What limits how many patients a dental practice can treat?
The resource with the highest implied utilization is the bottleneck, and its capacity sets total practice capacity. In high-volume practices, that constraint is usually the coupling between dentists and dental chairs.
How often do AI Overviews appear for dental searches?
In ScaleUp Dental's 100-keyword sample, 94% of cost and insurance queries and 92% of treatment comparison queries returned an AI Overview, compared with 36% of near-me and 10% of city queries.
How often do AI assistants name a specific local business?
A 2026 Formula Won Labs audit across 58,882 US local businesses found AI search engines named a specific local business in conversational answers only 5% of the time.
Sources
- Comprehensive Analysis of Factors Influencing Patients ... - pmc.ncbi.nlm.nih.gov (2024-12-30)
- Kostov_Georgieva - Revista UCR - revistas.ucr.ac.cr (2026-09-27)
- Optimizing the dentist-chair coupling constraint in high-volume dental operations: a system dynamics-based decision support approach - doi.org (2026-06-03)
- Aspen Dental | Birdeye - birdeye.com (accessed 2026)
- Protect your practice’s reputation | American Dental Association - ada.org (accessed 2026)
- Dental practice profitability: Using data to improve capacity and productivity | Dental Economics - dentaleconomics.com (2026-09-09)
- Local Business AI Visibility Audit (2026) | Formula Won Labs - formulawonlabs.com (2026-06-21)
- AI SEO Services for Dental Clinics (GEO) | ScaleUp Dental - scaleupdental.com (accessed 2026)
- High-Value Dental Procedure Mix: Building Revenue Beyond Basic Restorative - resources.rework.com (2026-03-19)